You can classify the classes in a histogram according to the values of one or multiple matrices. For instance, you can display in this way, how the trips of a demand matrix spread across the journey distances. For that purpose, display the demand matrix data in the histogram in a classified view according to a skim matrix which represents the journey distances.
1. Make sure that the histogram is open (Creating a histogram).
2. Click the View options icon  .
.
The View options of matrix histogram window opens.
3. Select the Use classification matrix option.
 .
.The Select classification matrix window opens.
5. Select the desired classification matrix.
6. To create a multi-dimensional classification, repeat step 4.
7. Confirm with OK.
8. Set the desired intervals (Creating a histogram).
9. Click the  Recalculate classification icon.
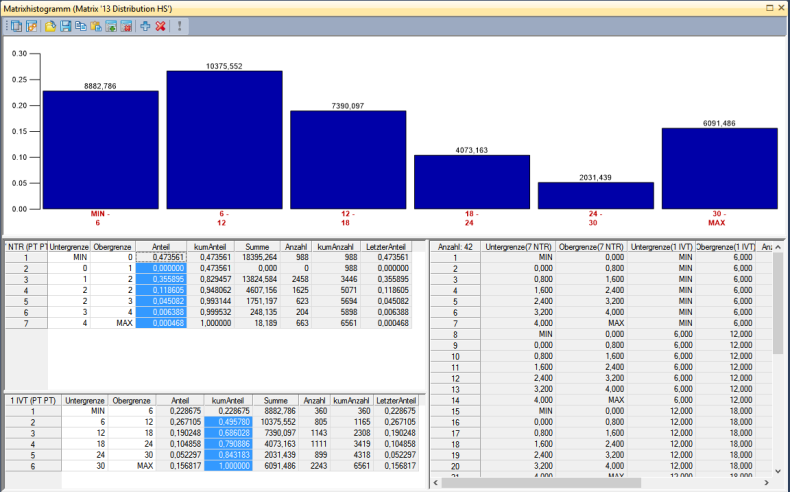
The histogram is then shown in the top section of the window. The intervals are displayed in the lower section. If you have created a multi-dimensional histogram, the lower section is divided. The left half shows the intervals of all dimensions in a list. Click an interval to display the respective histogram in the upper section. The right half shows a cross-classified table of all intervals in the left half.